
Reading Price Action Without Indicators
Learn how to interpret candlestick patterns, support and resistance levels, and market structure — the foundational skills before adding technical indicators to your analysis.

Why Price Action Matters
Most traders dive straight into indicators — moving averages, RSI, MACD, Bollinger Bands. But here's the thing: you're looking at derivatives of price, not price itself. The real information's already there in the candlesticks.
Price action analysis means reading what the market's actually doing — where buyers and sellers are battling, where momentum is breaking down, where the next move is likely coming from. It's not faster than indicators. It's not easier. But it gives you something more valuable: direct access to market psychology.
The Foundation
Before you can read price action effectively, you need to understand three core elements: candlestick formation, support/resistance structure, and market structure trends. Master these and indicators become optional.
01
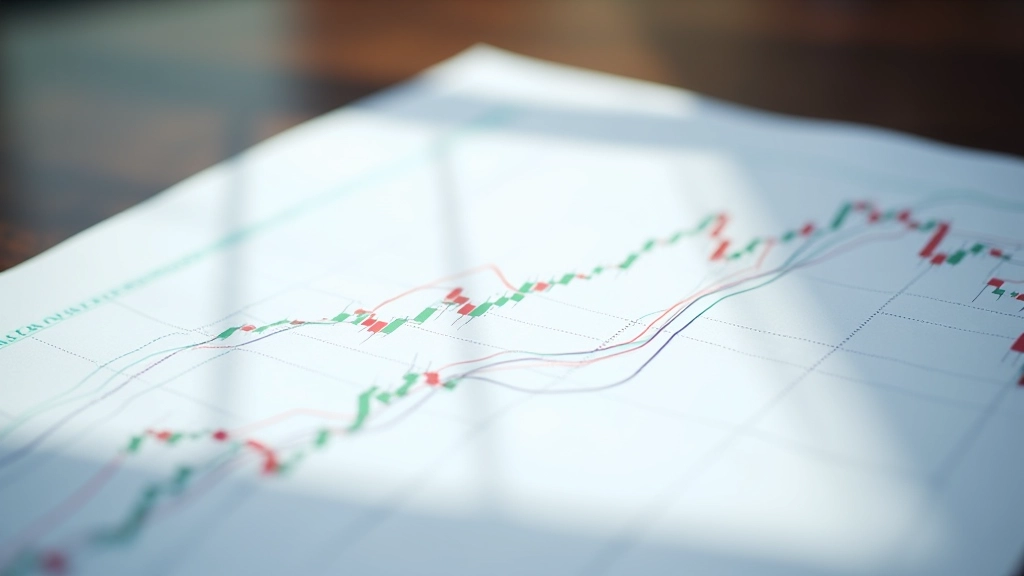
Understanding Candlestick Formation
A candlestick tells a complete story about what happened during a time period — let's say a 4-hour candle on EUR/USD. The open price is where sellers and buyers agreed to start. The close is where they ended up. The wicks (the thin lines extending from the body) show the extremes both sides tested.
When you see a candle with a long lower wick and a small body, that's rejection — sellers pushed the price down but buyers defended. That's information. It means there's support being respected. A candle closing near its high with minimal upper wick? Buyers are in control and tested resistance but held their ground.
The key is consistency. You're looking for patterns that repeat — not "this exact candle formation always means X," but "when price does this, what typically follows?" After 20, 50, 100 observations you'll start noticing rhythms in how markets move.

02
Support and Resistance Levels
Support and resistance aren't magical lines. They're areas where enough traders have made decisions in the past that price tends to react when it returns to those levels. A support level is where buyers have stepped in before. When price comes back to that level, they're watching — they might buy again.
The strongest support/resistance comes from areas where price spent significant time consolidating or reversed sharply. If GBP/USD bounced five times from 1.2650 over three months, that level's now imprinted in traders' minds. When price approaches it again, there's genuine buying pressure because traders remember it worked before.
You'll notice that resistance often becomes support once price breaks through it decisively. That 1.2650 level stops being a ceiling and becomes a floor. This happens because traders who were holding short positions get stopped out, and new buyers see the breakout as confirmation to enter.
Deepen Your Knowledge

03
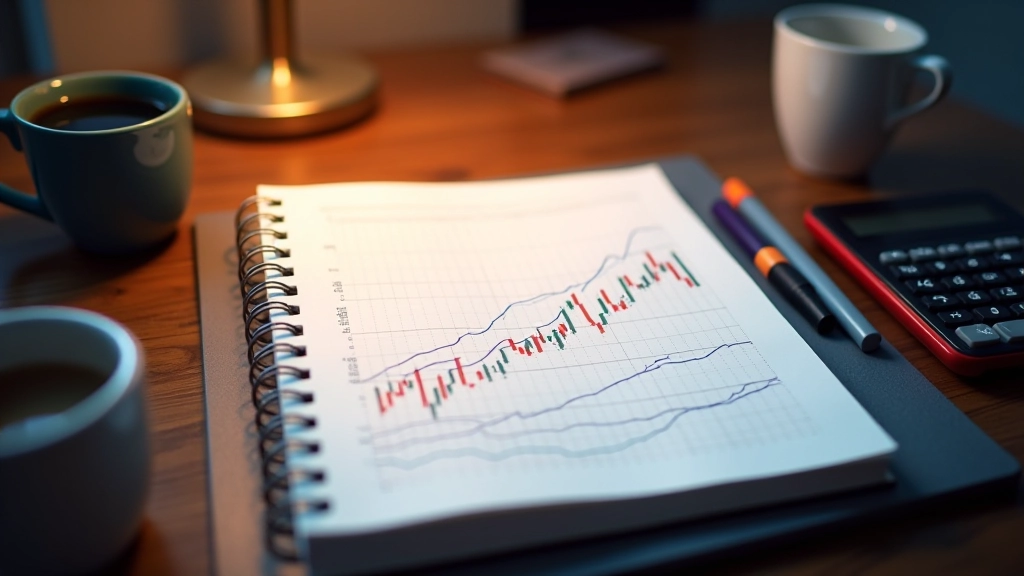
Market Structure and Trend Direction
Market structure is how price is moving — are we making higher highs and higher lows (uptrend), lower highs and lower lows (downtrend), or bouncing sideways (consolidation)? This is the biggest-picture element of price action.
Here's what you're really looking for: Where is the last higher low in an uptrend? That's your support — the level that, if broken, signals the trend might be changing. Same logic inverted for downtrends. The moment price breaks that last higher low, you've got a structural break. Suddenly, your risk/reward calculation changes because the trend context has shifted.
Most traders miss this because they're focused on entry signals. But price action traders know: structure comes first. If you're not in an uptrend, don't be looking for buy signals. If you're not in a downtrend, be cautious about short setups. It sounds simple but it cuts your losing trades dramatically because you're trading with the structure, not against it.

04
Confluence Zones and Entry Planning
The real power of price action emerges when multiple elements align. You're not looking for a single signal — you're looking for confluence. Where does a support level meet a trend line? Where does price structure create a zone that's been tested multiple times? That's where you plan entries.
Let's say you're analyzing the daily chart on USD/JPY. You've identified an uptrend with clear higher lows. The last higher low sits at 149.50. You also notice that 149.50 is exactly where a 50-day trend line sits. Now price pulls back toward 149.50 — that's not just one reason to consider buying, that's two. You've got structural support plus trend line support creating a confluence zone.
When price reaches that zone, you're looking at candlestick formations — is there a rejection candle? Are wicks showing buying pressure? Is the close near the high or does it close near the low? These details tell you if confluence is actually working or if this time is different. That's where price action transitions from pattern recognition to active decision-making.
05
Building Your Price Action Skills
1
Start with one asset and one timeframe
Don't jump between EUR/USD, Gold, and crude oil. Pick one — something with consistent volatility and decent volume. Spend weeks on just that asset on the daily timeframe until patterns start jumping out at you.
2
Mark support and resistance manually
Print the chart or draw zones in your charting software. See where price bounced. Draw horizontal lines. Notice which zones get tested repeatedly. This manual process burns the levels into your brain better than any indicator ever will.
3
Identify the trend structure
Before analyzing anything else, establish whether you're in an uptrend, downtrend, or consolidation. Mark the higher highs/lows or lower highs/lows. This becomes your directional bias.
4
Study candlestick reactions at key levels
When price approaches support, what do the candlesticks do? Do they show rejection? Long lower wicks? Strong closes? Keep notes. After 30 observations you'll start seeing patterns in how that particular level responds.
5
Paper trade with your observations
Don't trade real money yet. Track your price action observations in a journal. When you see a confluence setup forming, write it down. Did it work? Why or why not? Build a personal database of what works for that asset.
The Path Forward
Price action analysis won't make you rich overnight. It won't eliminate losses. But it will give you something more valuable: a direct connection to what the market's actually doing. You'll stop relying on lagging indicators that confirm what price already showed you three candles ago.
The traders who last years in this field aren't the ones chasing the hottest indicator. They're the ones who understand price structure, who read what candlesticks are telling them, and who plan entries around confluence zones. They trade with conviction because they understand the why behind price movement.
Start small. Study one asset. Mark your levels. Watch how price reacts. The skill develops slowly, but it develops. And unlike indicators that change every market cycle, the fundamentals of price action — structure, support, resistance, confluence — they don't change. They're the foundation everything else is built on.
Important Disclaimer
This article is for educational purposes only. It's not trading advice, investment advice, or a recommendation to buy or sell any financial instrument. Price action analysis is one analytical framework — it works in some market conditions and doesn't in others. Past performance doesn't guarantee future results. Trading carries real risk of loss. Always trade with money you can afford to lose, use proper risk management, and consider consulting with a qualified financial advisor before making trading decisions.