Advanced Guide
Backtesting Your Strategy: Methodology and Pitfalls
How to properly test trading ideas on historical data, common mistakes that lead to false confidence, and what realistic performance expectations actually look like.

Why Backtesting Matters — But It's Not What You Think
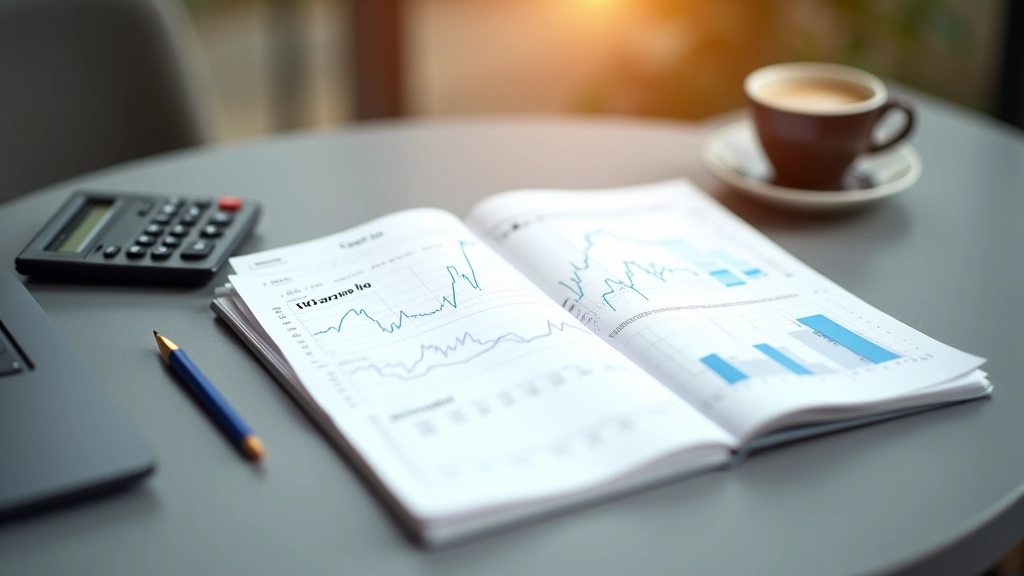
You've got an idea. A trading strategy that seems logical on the surface — maybe it's based on a pattern you've noticed, or a relationship between two assets that catches your attention. Before you risk real capital, you want to know: does this actually work?
That's where backtesting comes in. It's the process of testing your strategy against historical data to see how it would've performed in the past. Sounds straightforward, right? But here's what separates traders who learn from backtesting from those who get fooled by it: understanding what you're actually looking at, and knowing exactly where the traps are hiding.
We're not going to tell you backtesting is the answer to everything. It's not. But done correctly — with real awareness of its limitations — it's one of your most valuable tools for developing confidence in an idea before you commit to it.
The Core Reality
Perfect historical performance doesn't guarantee future results. The best backtests catch real edge, but they also catch luck. Your job is learning the difference.
01
The Basic Methodology: What Actually Happens
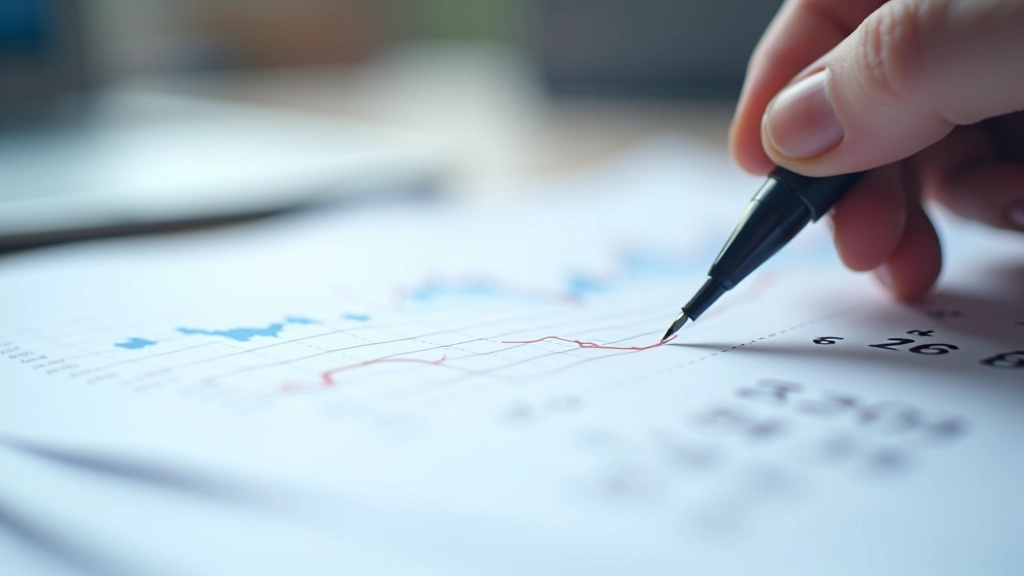
Backtesting follows a straightforward process. You define your rules — entry signals, exit conditions, position sizing, everything. Then you run your strategy through historical price data (usually years worth) and record what would've happened if you'd followed those rules exactly.
Let's say your strategy is: buy when the 20-day moving average crosses above the 50-day moving average, sell when it crosses back below. You'd take every instance in the past 5 years where that crossover occurred, simulate the trade at that exact price, and track the results. Win rate, average win, average loss, maximum drawdown — all of it gets calculated.
The data you're using matters tremendously. You need:
- Clean, adjusted price data (accounting for splits and dividends)
- Enough historical data (minimum 5 years, ideally 10+)
- The right market conditions for your strategy
- Realistic assumptions about execution and slippage
Most traders underestimate how important that last point is. You can't assume you'll enter at the exact open price if your strategy signals at 2pm. You can't ignore transaction costs. These details sound small until they're the difference between a profitable strategy and a losing one.
02
The Pitfall Everyone Falls Into: Curve Fitting
This is the trap that catches most people. It happens so naturally that you don't even realize you're in it until your live trading blows up.
Here's how it works: You backtest your strategy. The results look mediocre. So you tweak a parameter. Maybe you change the moving average length from 20 to 23. Better results. So you adjust again. And again. You optimize the entry threshold, the exit conditions, the position size. You're not making up fake rules — you're just fine-tuning based on what the historical data tells you works.
The problem? You're fitting your strategy to the specific quirks of that historical period. You've optimized it so perfectly to the past that it stops being a real edge and becomes a lucky fit. When you trade it forward, you get slapped.
The warning signs you're curve fitting:
- Unrealistic win rates (above 70% is a red flag)
- Parameters that are weirdly specific (23.7 instead of round numbers)
- Performance drops dramatically on more recent data
- You've tweaked more than 2-3 parameters significantly
The solution? Use out-of-sample testing. Test your optimized parameters on data your algorithm never saw. If performance holds up on that fresh data, you've probably got something real.

03
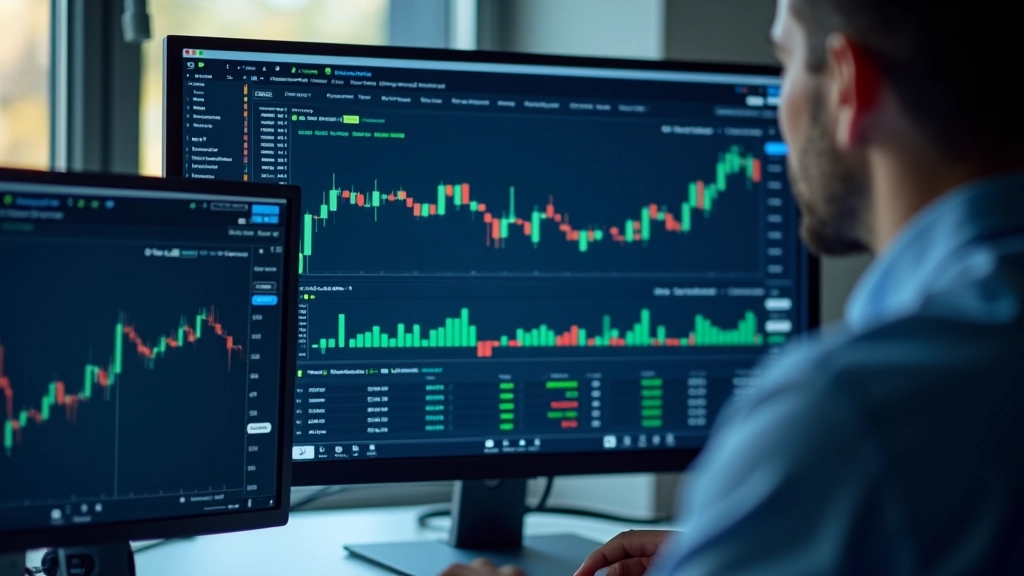
The Hidden Assumptions That Wreck Everything
Even if you avoid curve fitting, your backtest still makes assumptions. These are usually invisible unless you're specifically looking for them. And they'll cost you money if they're wrong.
First: execution prices. Your backtest assumes you can enter and exit at exact prices shown in the data. Real trading doesn't work that way. If you're trying to buy at the open, slippage will eat you. If you're signaling during the day but using next-day open prices, you're ignoring intraday volatility. Build in realistic slippage — usually 1-3 basis points minimum depending on liquidity.
Second: commissions and fees. These sound small until you're making 50 trades a month. A $5 commission per trade becomes $3,000 per month in costs. If your strategy only makes $2,500, you're underwater before you start. Don't skip this.
Third: survivorship bias. Your historical data includes every stock or instrument that survived to today. It doesn't include the ones that went bankrupt, got delisted, or stopped trading. If your strategy would've loaded up on failed companies, your backtest is lying to you.
Fourth: market regimes. The strategy you're testing might've worked beautifully in a trending market but gets shredded during sideways choppy conditions. Your backtest average includes both. Does it perform acceptably in each regime separately?

04
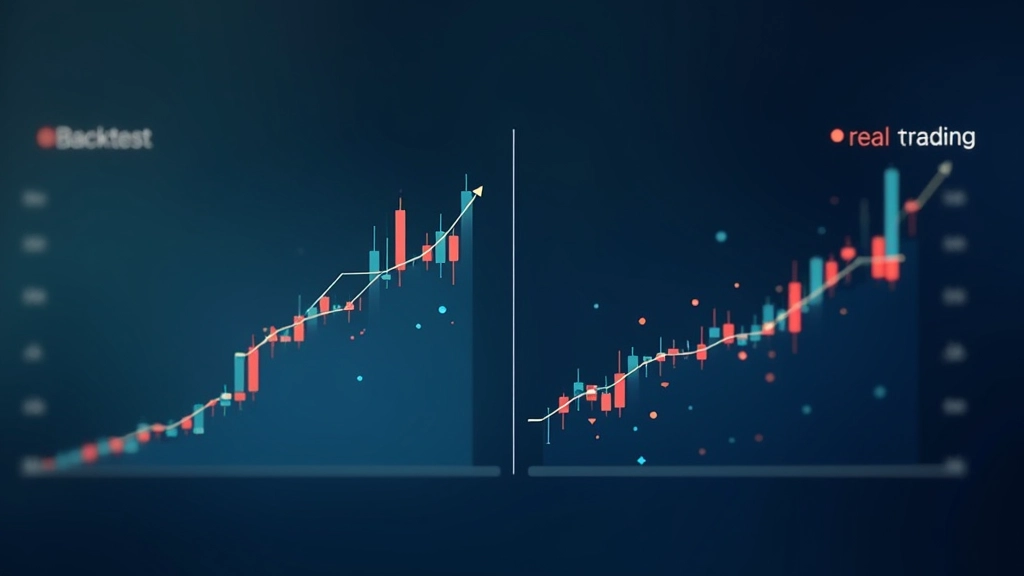
What Realistic Results Actually Look Like

When you're evaluating a backtest, you're looking for something specific: not the best possible result, but evidence of real edge over a realistic time horizon.
A strategy with a 55% win rate, 10% annual return, and 15% maximum drawdown? That's actually credible. It's not flashy. It doesn't promise to change your life. But it's the kind of performance that might survive real trading.
A strategy with 75% win rate and 50% annual returns? Skeptical. Not impossible, but skeptical enough that you should dig deep into the assumptions and test it on data you didn't use for development.
Here's what matters most in the numbers:
Win Rate
50-65%
Realistic. Edge doesn't require winning most of the time.
Profit Factor
1.5-2.0+
Gross profit divided by gross loss. Higher is better.
Drawdown
10-25%
Can you stomach this decline psychologically?
Consistency
Positive in 70%+ of years
Edge persists across different market conditions.
The real test isn't what the numbers say. It's whether you can actually trade it. If the strategy requires 15 trades per day and you don't have time for that, it doesn't matter if the backtest looks perfect. If it's psychologically brutal — like enduring 40% drawdowns — you'll abandon it in the next bear market anyway.
The Backtest is a Starting Point, Not a Destination
Done right, backtesting is invaluable. It forces you to define your rules precisely. It shows you where your strategy struggles. It separates ideas that might work from ideas that probably won't. That's genuinely useful.
But it's not a crystal ball. Your backtest won't tell you about the market regime shift coming in six months. It won't account for the algorithm update that changes how your target asset trades. It definitely won't tell you whether you have the discipline to stick with it when real money is on the line.
Use it as a filter. If your strategy fails the backtest, scrap it — it probably doesn't have edge. If it passes, you've cleared the first hurdle. Then comes the hard part: testing it forward with real capital, learning from actual results, and adjusting as markets evolve. That's where traders are actually made.
Educational Information
This article is educational material designed to help you understand backtesting methodology and common pitfalls. It is not financial advice, investment recommendation, or a guarantee of any specific outcome. Past performance in backtests does not guarantee future results. All trading involves substantial risk of loss. Before implementing any trading strategy, consult with a qualified financial advisor and conduct your own thorough research. Market conditions, data quality, and individual circumstances vary significantly, and what works in historical analysis may not work in live trading.